Electricity prices by state, and what appliances cost to run in each
Bottom line
The same appliance costs about 3.7 times as much to run in Hawaii (46.41¢/kWh) as in North Dakota (12.46¢/kWh). A typical ENERGY STAR refrigerator (460 kWh/yr) costs $213 a year in Hawaii, $57 in North Dakota and $84 at the US average.
18 of the 50 states and DC pay more than the US average of 18.19¢ per kWh. To adapt the rule of thumb, divide annual kWh by the number in the “Divide kWh by” column instead of 5.5.
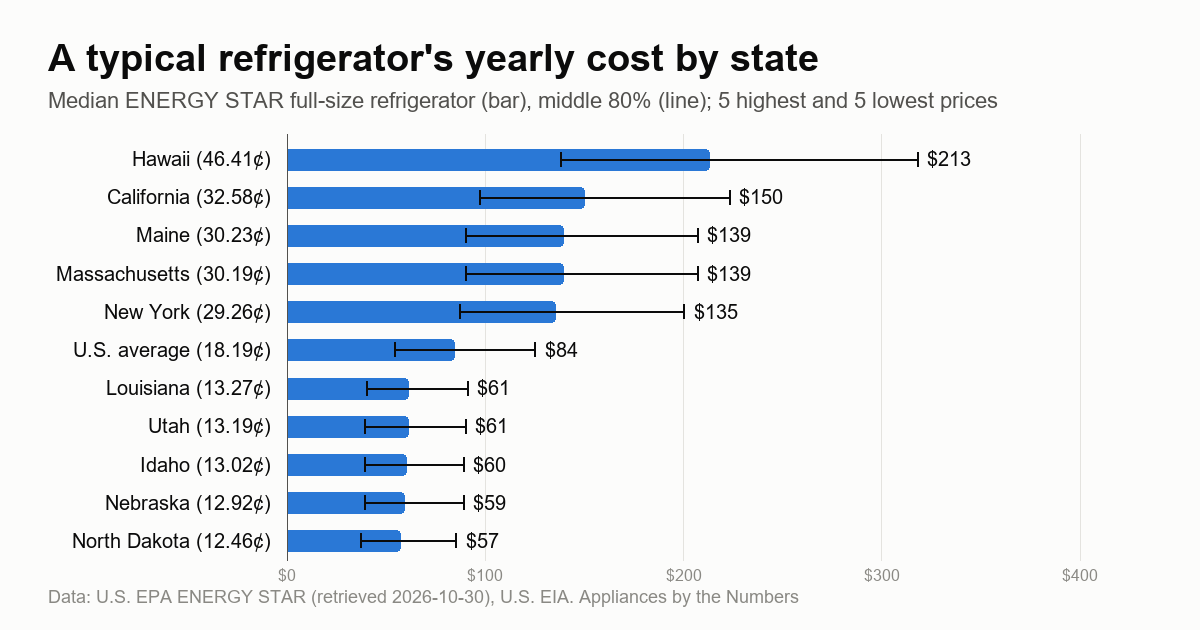
All states, highest price first
Select a state for the yearly cost of all six appliances at its price.
| # | State | ¢ per kWh | vs US | Divide kWh by | Refrigerator $/yr | Room AC $/yr |
|---|---|---|---|---|---|---|
| 1 | Hawaii | 46.41 | +155% | 2.2 | $213 | $247 |
| 2 | California | 32.58 | +79% | 3.1 | $150 | $173 |
| 3 | Maine | 30.23 | +66% | 3.3 | $139 | $161 |
| 4 | Massachusetts | 30.19 | +66% | 3.3 | $139 | $161 |
| 5 | New York | 29.26 | +61% | 3.4 | $135 | $156 |
| 6 | Rhode Island | 29.05 | +60% | 3.4 | $134 | $155 |
| 7 | Connecticut | 27.47 | +51% | 3.6 | $126 | $146 |
| 8 | Alaska | 27.32 | +50% | 3.7 | $126 | $145 |
| 9 | New Hampshire | 26.91 | +48% | 3.7 | $124 | $143 |
| 10 | District of Columbia | 24.86 | +37% | 4.0 | $114 | $132 |
| 11 | New Jersey | 24.09 | +32% | 4.2 | $111 | $128 |
| 12 | Vermont | 23.93 | +32% | 4.2 | $110 | $127 |
| 13 | Michigan | 21.73 | +19% | 4.6 | $100 | $116 |
| 14 | Maryland | 21.31 | +17% | 4.7 | $98 | $113 |
| 15 | Pennsylvania | 21.13 | +16% | 4.7 | $97 | $112 |
| 16 | Illinois | 19.23 | +6% | 5.2 | $88 | $102 |
| 17 | Wisconsin | 19.05 | +5% | 5.2 | $88 | $101 |
| 18 | Ohio | 18.81 | +3% | 5.3 | $87 | $100 |
| U.S. average | 18.19 | — | 5.5 | $84 | $97 | |
| 19 | Delaware | 17.98 | −1% | 5.6 | $83 | $96 |
| 20 | Indiana | 17.04 | −6% | 5.9 | $78 | $91 |
| 21 | Virginia | 16.95 | −7% | 5.9 | $78 | $90 |
| 22 | Colorado | 16.80 | −8% | 6.0 | $77 | $89 |
| 23 | Alabama | 16.51 | −9% | 6.1 | $76 | $88 |
| 24 | Minnesota | 16.44 | −10% | 6.1 | $76 | $87 |
| 25 | Texas | 16.03 | −12% | 6.2 | $74 | $85 |
| 26 | South Carolina | 15.90 | −13% | 6.3 | $73 | $85 |
| 27 | West Virginia | 15.58 | −14% | 6.4 | $72 | $83 |
| 28 | Georgia | 15.48 | −15% | 6.5 | $71 | $82 |
| 29 | Oregon | 15.46 | −15% | 6.5 | $71 | $82 |
| 30 | Arizona | 15.36 | −16% | 6.5 | $71 | $82 |
| 31 | New Mexico | 15.34 | −16% | 6.5 | $71 | $82 |
| 32 | Florida | 15.32 | −16% | 6.5 | $70 | $81 |
| 33 | Kansas | 15.26 | −16% | 6.6 | $70 | $81 |
| 34 | Mississippi | 15.06 | −17% | 6.6 | $69 | $80 |
| 35 | North Carolina | 14.94 | −18% | 6.7 | $69 | $79 |
| 36 | South Dakota | 14.58 | −20% | 6.9 | $67 | $78 |
| 37 | Iowa | 14.55 | −20% | 6.9 | $67 | $77 |
| 38 | Washington | 14.42 | −21% | 6.9 | $66 | $77 |
| 39 | Missouri | 14.28 | −21% | 7.0 | $66 | $76 |
| 40 | Kentucky | 14.20 | −22% | 7.0 | $65 | $76 |
| 41 | Montana | 14.13 | −22% | 7.1 | $65 | $75 |
| 42 | Wyoming | 14.01 | −23% | 7.1 | $64 | $75 |
| 43 | Oklahoma | 13.81 | −24% | 7.2 | $64 | $73 |
| 44 | Tennessee | 13.80 | −24% | 7.2 | $63 | $73 |
| 45 | Arkansas | 13.74 | −24% | 7.3 | $63 | $73 |
| 46 | Nevada | 13.36 | −27% | 7.5 | $61 | $71 |
| 47 | Louisiana | 13.27 | −27% | 7.5 | $61 | $71 |
| 48 | Utah | 13.19 | −27% | 7.6 | $61 | $70 |
| 49 | Idaho | 13.02 | −28% | 7.7 | $60 | $69 |
| 50 | Nebraska | 12.92 | −29% | 7.7 | $59 | $69 |
| 51 | North Dakota | 12.46 | −32% | 8.0 | $57 | $66 |
Prices: average residential price, EIA Electric Power Monthly, Table 5.6.B, residential, January–August 2026 year-to-date. Refrigerator = median ENERGY STAR full-size refrigerator (460 kWh/yr). Room AC = median ENERGY STAR room air conditioner (532 kWh/yr at the federal test's rated hours; real use varies by climate). Averages include fixed charges spread over usage, so your price per extra kWh can differ: check your own bill.
By appliance
Each appliance page lists its running cost in every state: Refrigerators · Room air conditioners · Clothes dryers · Clothes washers · Dehumidifiers · TVs.